Your advantages with the DFT control station at a glance:

Der schwarze Umriss eines Kreises weist vier nach außen gerichtete Pfeile auf, die jeweils zum Rand zeigen. Das Design ähnelt einem Kreuzgürtel mit zwei diagonalen Linien, die sich in der Mitte kreuzen. Die Pfeile sind gleichmäßig verteilt.

Central control

All relevant tools and data bundled in one digital control center

Ein einfaches schwarzes Lupensymbol auf weißem Hintergrund mit einer kurzen gebogenen Linie innerhalb des Linsenbereichs – ideal zur Darstellung prädiktiver oder präventiver Servicekonzepte.

Real-time transparency

Clear visualization of system statuses, errors and material flows

Schwarzes Symbol, das eine Uhr zeigt, die sich teilweise mit einem Balkendiagramm und einem nach oben gerichteten Pfeil überlappt. Es symbolisiert präventives Zeitmanagement, Produktivität oder Unternehmenswachstum. Der Hintergrund ist weiß.

Greater efficiency

Optimized processes through intelligent personnel and material flow planning

A black silhouette of a person with short hair, wearing sunglasses and a beard, looking to the right, against a white background—evoking thoughts on the seamless artistry of returns managements precision and contrast.

Faster decisions

Data-based foundations for operational and strategic measures

Ein schwarzweißes Symbol eines übereinander gekreuzten Schraubenschlüssels und Schraubenziehers, das Werkzeuge oder Einstellungen im Zusammenhang mit den Push Tray Sorter-Funktionen auf weißem Hintergrund symbolisiert.

Less downtime

Proactive maintenance planning and fast fault localization

Ein ausgefülltes Quadrat mit einem nach außen zeigenden Pfeil aus der oberen rechten Ecke überlappt ein größeres gestricheltes Quadrat und symbolisiert „Erweitern“, „In neuem Fenster öffnen“ oder die Aktivierung von Funktionen wie einem Push Tray Sorter.

Modular & scalable

Perfectly adaptable to your individual warehouse structure and company size

Transparency, control and efficiency in real time - for your intralogistics

Person analyzing data in case of Predictive Services.

The DFT control center ensures that your intralogistics are fully visible, efficiently controllable and optimally equipped for future requirements. By setting up a central control center, you gain comprehensive control over all logistics processes within your company – in real time. This means that processes can not only be monitored, but also controlled and adapted in a targeted manner to ensure maximum efficiency and remain competitive in the long term.

Redpilot: Intelligent resource management in real time

Redpilot is your tool for dynamic workforce scheduling. Depending on the current system status, the tool enables flexible rescheduling of personnel and tasks – ideal in the event of breakdowns, peak loads or shift adjustments. Redpilot also offers an integrated maintenance planning system (CMMS) that efficiently organizes and documents preventive and acute maintenance activities. This allows you to ensure availability and system performance at a high level – data-based and resource-saving.

Illustration of hands holding a smartphone displaying the realPilot logo. Surrounding icons include a heart monitor, clock, calendar, and graph, suggesting themes of health, time management, scheduling, and data analysis.

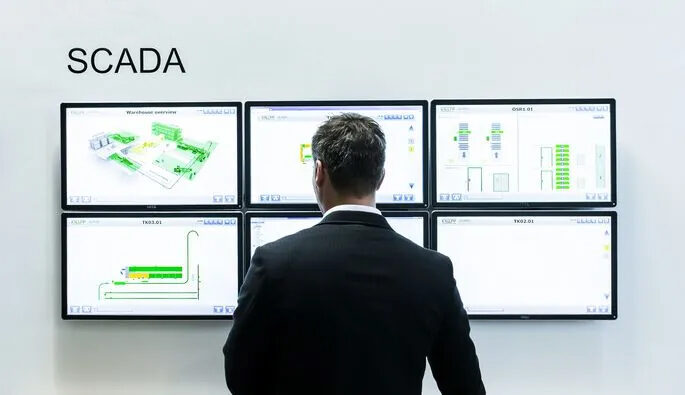
SCADA: Visualize and localize error states

A person in a suit stands facing six large monitors displaying diagrams and data. The word SCADA is written on the wall to the left. The screens show various technical schematics and data charts.

Our SCADA-supported error status visualization enables you to detect system errors in real time and locate them precisely in the material flow system. Thanks to the visual processing in the control center, your teams can react immediately, rectify faults in a targeted manner and reduce downtimes to a minimum. This increases the technical availability of your system in the long term.

WCS: Material flow visualization in real time

The Warehouse Control System (WCS) ensures transparent and reliable control of the material flow - from batch processing to dispatch provision. The live visualization in the control station enables you to identify bottlenecks at an early stage, control orders intelligently and improve the overall performance of your warehouse. Especially with high throughputs or variable order situations, this real-time control is a real competitive advantage.

KiSoft One Analytics: Data-based process optimization

Person holding a tablet displaying performance metrics, including order deviation, order rate in items per hour, and packing performance graphs. The background features shelves with electronic equipment.

KiSoft One Analytics gives you in-depth insights into past system statuses – at a technical and process level. The solution offers powerful dashboards with which you can identify weak points, evaluate KPIs and derive well-founded optimization measures. This allows you to transform historical data into operational knowledge – and drive your intralogistics forward in a targeted manner.